| Target: Large and medium-sized BtoC companies. Manufacturers, retailers and service providers of housing, automobiles, home appliances, furniture, clothing, jewelry, watches, food, beverages, travel, food and beverage, entertainment, art, etc. |
Step 1: Create a conflict map
First, let us create a free competitive positioning map of the market in which your product/service resides using our AI and data mining technology .
Check out this example of what you can create: a map of the global passenger vehicle market in 2024. Download our free map example and free visualization tool.
Free Map Examples
Free visualization tools
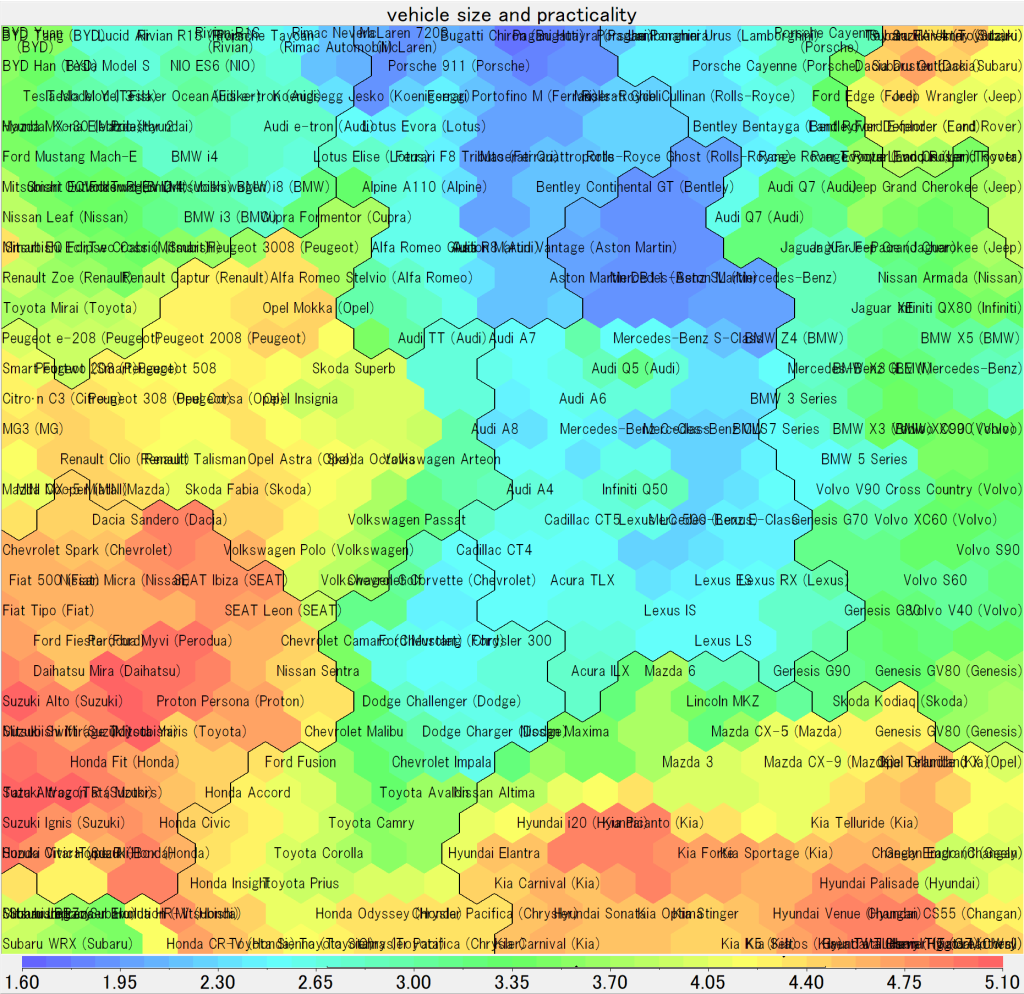 Map of the global passenger vehicle market in 2024
Learn how to explore this map here: Click anywhere on the map to instantly find similar vehicles.
Traditionally, competitive maps have been created by using methods such as principal component analysis to create standardized, quantitative data such as product specifications, but this method has the drawback of missing a lot of unstandardized information. At Mindware Research Institute, we have succeeded in establishing technology that quantifies information without losing its subtleties by vectorizing amorphous qualitative information , and then extracts dimensions that can be interpreted by humans. For example, the passenger car market map above is expressed in the following seven dimensions:
1st axis: vehicle size and practicality
2nd axis: descriptions of luxury vehicles 3rd axis
: vehicle performance and ruggedness 4th axis:
Eco-Friendly/Electric Vehicles vs. Luxury/Refined Vehicles 5th axis
: eco- friendly/electric vehicles vs. luxury/refined
vehicles 6th axis: electric vehicles 7th
axis: futuristic or innovative design
Previously, these were things that could only be expressed qualitatively, but what’s important is that they have now been beautifully quantified.
Please use this form to request the creation of a competitive map for your company. The only information required in advance is (1) your company name, (2) the product/service field to be surveyed, and (3) your current product/service name. However, we can only conduct research and analysis for well-known companies and products/services.
(In principle, it is possible to analyze local store competition, but please refrain from doing so unless there are special circumstances.)
However, we can only send you the visualized map file for free. To explore (mine) the map like in the automotive example above, you need the data associated with the map. Only if you like your own competitive map, purchase the full file. We will inform you about it after the map is created.
We are confident that even up to this point, we can be of great help to your product planning and marketing, but our true strength lies beyond this. In other words, we use AI to propose new concepts for your products/services. For companies that would like to proceed further, we will submit a proposal for the following paid analysis.
Step 2: Define your target audience
To use the above competitive map to create a strategically effective new concept, you need to identify the map areas where your target customers have a high response (preference, support, or interest). In other words, you need to research consumer reactions to your competitors’ products/services. If you have a large number of competitors and cannot research all of them, you should at least research representative competing products/services, or research reactions by type.
In principle, please prepare the survey data yourself. If you are conducting a new survey, we will consult with you on survey design (for a fee).
Once the survey data is prepared, we will use it for data mining. The purpose of data mining is to discover the group of consumers (target group) that you will strategically target. The data mining technique we will use is SOM clustering.
*Toyota Motor Corporation has been using our data mining tools for the past 17 years to analyze survey data of automobile users around the world.
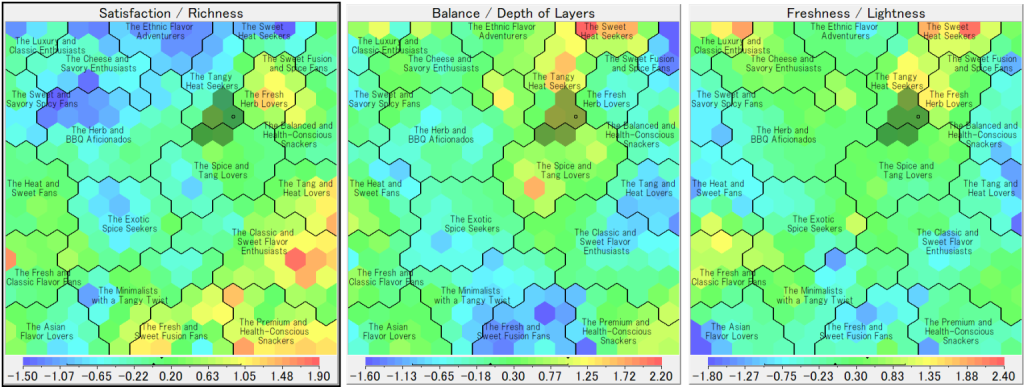 Potato chip consumer clustering and target group discovery
Once you have identified your target group, collect consumer response data from those groups and relate it to your competitive map.
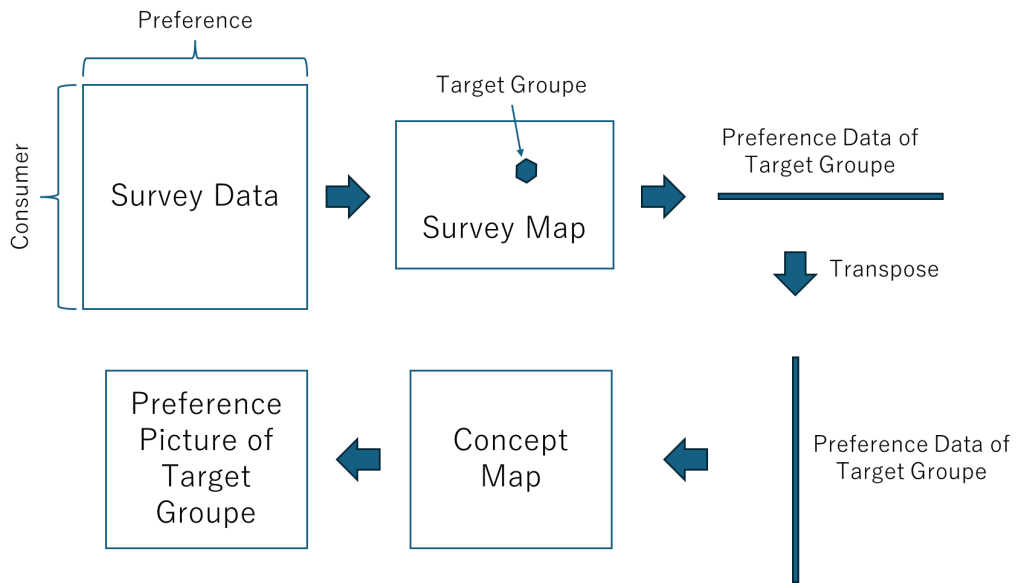
Third step: Explore new concepts
The concept map is complete when you can associate the target group’s response value with the competitor map you created first. On the map, where competing products are arranged in the same order as the competitor map you created in the first step, you can create a picture that shows the level of response (preference, etc.) of the target group’s consumers to each product. Therefore, the area with a high response in that picture, and the gap area where no competing products exist yet, is the “area to attack.” This is defined as the ” target area .”
By taking the attribute values corresponding to a target area and presenting them to the LLM, it is possible to infer new product or service concepts that are relevant to that area.
Combining LLM and data mining in this way enables strategically targeted concept exploration.
A fictional example of a new potato chip concept
Numerical features
- UM1: 7.62 → Medium satisfaction/richness
- The richness and satisfaction of the flavor is neither too strong nor too light, with an exquisite balance that makes it a rich taste that is easy for everyone to enjoy.
- UM2: 9.46 → Very well balanced and deep in flavor
- The flavor is multi-layered, suggesting a good balance of multiple elements: sweet, salty, sour, etc. are intertwined in a well-balanced way, and it is not monotonous.
- UM3: -0.03 → A bit richer and heavier than light.
- It is not light or refreshing, but rather has depth and umami. Expect spiciness and rich flavors.
Product concept: “Spice Honey Complex”
Flavor Characteristics
This flavor is a fusion of sweetness and complex spice .
- The first thing that hits you is the gentle sweetness and smooth richness of honey .
- Then, multiple spices such as cumin, garlic, and black pepper slowly spread throughout your mouth, breaking the monotony.
- The aftertaste is lightly tangy, creating a perfect balance between sweetness and spiciness.
Appearance
The golden chips are sprinkled with tiny flakes of black pepper and herbs, giving them a sophisticated look.
Target Audience
- Those who want to enjoy adult flavors
- Those looking for complex, deep flavors
- Gourmet consumers who want to enjoy both sweet and spicy flavors
Catchphrase
“Sweet and spicy, an addictive luxury.”
This concept is a well-balanced product design that provides just the right amount of satisfaction with UM1, makes use of the multi-layered depth of UM2, and successfully incorporates the weightiness and richness suggested by UM3.
Related information: By mapping technical papers, patents, news articles, etc. in a similar way to the competitive map above, it is also possible to develop a search system for similar research, similar patents, and similar news. Please feel free to contact us.