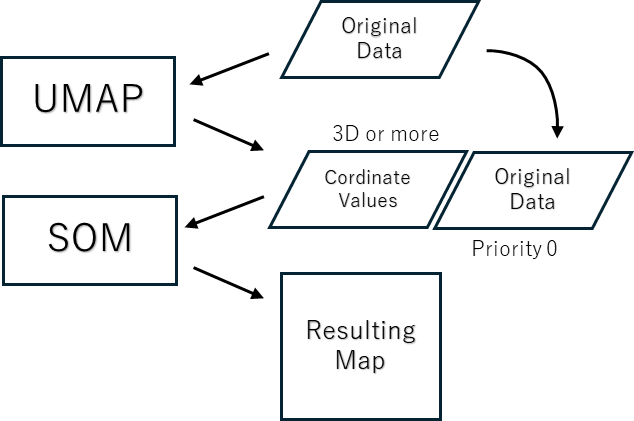
When performing data clustering (cluster analysis), the results change depending on which attributes (variables) are included in the analysis and how much weight is placed on each attribute, but traditional data science has tended to avoid discussing this fact head-on. Mindware Research Institute has neatly solved this problem from the perspective of concept research, and established a method for data mining big data with hundreds or thousands of dimensions from multiple angles.

The starting point of data science at Mindware Research Institute is that self-organizing maps (SOMs) can be considered as a tool to generate “concepts” from data. The concept of things changes depending on the “context”. When applied to data science, this corresponds to attribute selection and weighting. By changing the attributes and weightings input to SOM, conceptualization in various contexts can be expressed. Data mining (exploratory data analysis) provided by Mindware is to search for “more useful conceptualization” for the problem the user is addressing from various conceptualizations.
However, when the data contains hundreds, thousands, or even tens of thousands of attributes, such a explorer becomes virtually impossible. To solve this problem, it becomes necessary to stop treating each attribute as it is and to reorganize the dimensions using a method such as principal component analysis. In the case of SOM, attributes that contribute to the ordering of SOM (dimensional axis) and attributes that do not contribute (dimensional axis) can be created by weighting the attributes, so the original data can be analyzed on SOM by costructing SOM on the principal component space and associating the original attributes without contributing to the ordering. This method has been known among SOM experts for over 20 years.
However, because principal component analysis is a linear method (the correlation between attributes is based on linear correlation), in order to fully retain the information contained in the original data, it is necessary to calculate the same number of principal component axes as the number of attributes in the original data. If principal component axes with low contribution rates are discarded, a corresponding amount of information is discarded, so contrary to what is taught in textbooks, it does not actually reduce the dimension. However, since a large amount of information is retained in the higher-ranked principal component axes, it is possible to set the context by adjusting their weights. However, the weights are the basic weights obtained by dividing the contribution rate of each principal component by the contribution rate of the first principal component, and final weight gotten by multiplying them by the weights for context setting.
In this situation, t-SNE and UMAP have been devised in recent years as new dimension reduction methods. These are considered to be nonlinear dimension reduction methods, and UMAP can further retain the topological structure of the data based on a neighborhood graph. SOM has various capabilities other than dimensionality reduction, but when it comes to dimensionality reduction, UMAP has capabilities comparable to SOM.
In an experiment conducted at Mindware Research Institute, we found that in both t-SNE and UMAP, a map obtained by compressing a 1536-dimensional text embedding vector to 3 dimensions and inputting the coordinate values into a SOM produced a map that w3as almost comparable to a map obtained by directly learning SOM from 1536-dimensional data. While t-SNE can only select 2- or 3-dimensional output, UMAP allows any number of dimensions, up to 3 or more.
From the above, it is possible to replace principal component scores with UMAP scores as ordering data for SOM to set the context of ultra-multidimensional data. Mindware Research Institute plans to actively utilize this technique in the future to contribute to the efficiency of exploratory analysis of big data.