Today’s topic is “Brain Computer Interface”. As of March 25th, as a result of scraping news articles from the past 30 days, we were only able to collect about 20 articles. Therefore, today I created a simple map.
As usual, we obtained Embedding Vectors from the article title and abstract text and reduced their dimensionality with PCA. This time, we did not extract features or terms, but simply labeled the article titles directly on the map. Due to the small number of samples, this makes the map easier to interpret.
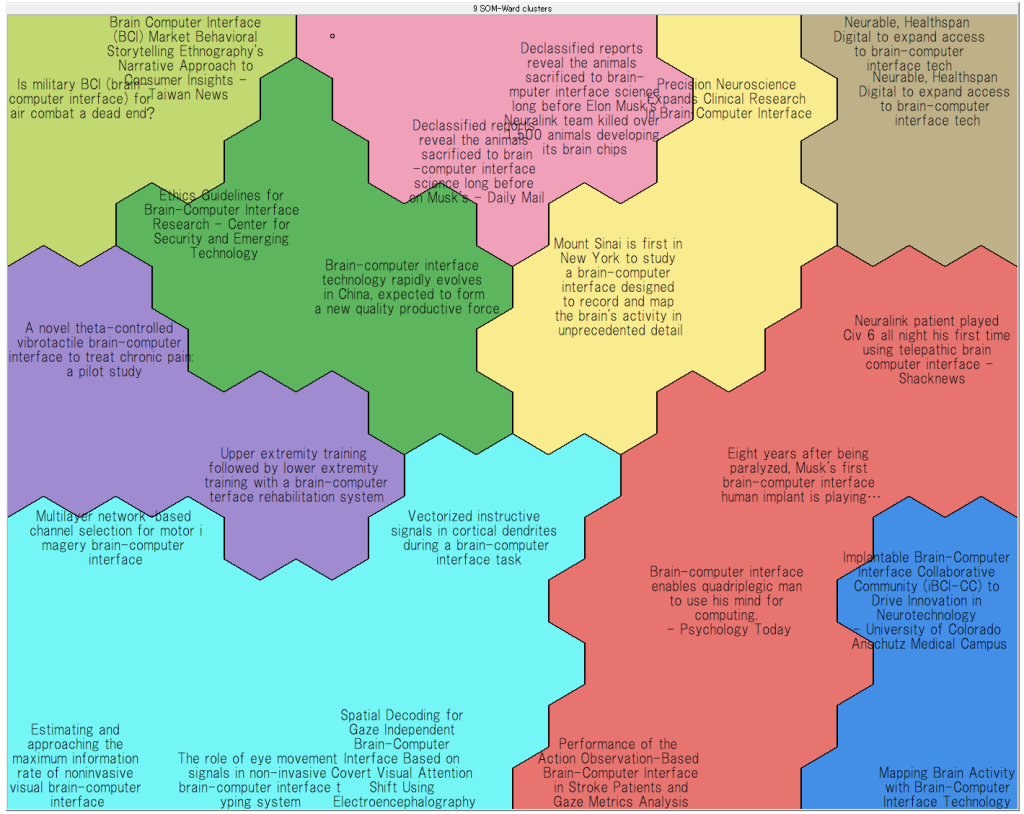
My native language is Japanese, so Japanese labels are easy to read and I can tell similarities and differences in meaning at a glance. In English, it can’t be done that quickly, but how about you?
The KJ method, which is an ideation method created in Japan, has the image of arranging ideas on a board according to their similarities, and connecting the relationships between them with lines and arrows. Howeve, our goal is not to implement the KJ method itself, but to obtain essentially the same effect as the KJ method on large-scale data. You will find that SOM is effective for arranging ideas and pieces of information by their similarities.
Viewer:
You can display this map with free software module of Viscovery SOMine Visual Explorer. Please download English version from here (Windows 10 or higher required). Japanese version is here.
SOM file:
And you can download the map file from here. However please note that underlying data mart is not included, so there is some limitation to explore and analyse it.
If you are interested in this map, you can become “paid E-mail member” of Mindware Innovation Maps, so that you have access to the project file including data mart, and “paid license member can access to full functionalities to mine data which unreduced dimensions. <read more…>
コメントを残す